Barbara F. Dawson
Evaluation MGMT 484
OILS 595 Internship
Fall 2025
Design-Based Research Evaluation Plan – Fall 2025 MGMT 484 Internship Project
Objective
This evaluation plan is for the internship project in the Summer & Fall 2025. The focus of this evaluation plan is to determine the degree of change in two areas for the Fall 2025 semester of Advanced Sales (MGMT 484). Student’s change in perceived comfort and confidence in the sales process and the corporate partners perceived expectations being met.
Purpose Statement
The purpose of the evaluation is to measure the extent to which this experiential course effectively grows the student’s comfort and confidence in sales. This course is broken up into four modules: Authentic Communication; job and internship interviews with corporate partners (CPs); a calling project where students cold-call leads; and finally, a sales role-play competition where the students compete for scholarship prizes. Additionally, we will explore the impact of any unexpected benefits that may emerge. The evaluation results will help us identify what’s working, where improvements can be made, and support the Sales Center in remaining relevant and responsive to evolving industry needs through its future programming.
Background
The Sales Center began building a robust sales course platform in the Spring of 2019. At that time there was only one offering, MGMT 384: Professional Selling, with an enrollment of 26 students.
In the Fall of 2025, the offerings have grown to include:
Three sections of MGMT 384
One section of Advanced Sales, MGMT 484
One section of Business Development, MGMT 586
Four sales competition teams, both for academic credit and not-for-credit.
Student headcount has grown concomitantly, from 26 in Spring 2019, to 132 in Spring 2025, a fivefold increase.
Corporate Partners support these offerings which are focused on preparing participating students to secure jobs in sales on or before graduating from the University of New Mexico.
Evaluation Objectives
Determine whether there is a statistically significant change in students’ perceived comfort and confidence in the sales process from the beginning to the end of the course. These changes are based on completion of a pre-course and end-of-course self-evaluation.
To qualitatively determine if the stakeholder’s needs and expectations of the project have been met through the engagement with MGMT 484 and the cold-calling generation of leads. This may be as simple as informing businesses that EV charging stations can be installed at their business. It may include increasing awareness and discovering barriers to installations which may include capital, placement, non-compete agreements with gas suppliers, etc. In what areas can we improve to make the partnership more effective and worthwhile?
Evaluation Questions
Sales Process Mastery: Pre and post self-assessment surveys were completed by each student to measure their perceived comfort and confidence across 20 sales cycle areas. The survey questions are listed in Appendix A. The paired-samples t tests results are listed in Appendix B.
Corporate Partner Satisfaction: Pre and post course interview with CP, PNM, to determine how the stakeholders describe their needs and expectations with the MGMT calling project. The interview questions that were asked before the calling project and after the calling project are listed in Table 1.
Data Collection Method
At the beginning, of the semester students were given a two-page survey with a breakdown of the sales process. They were asked to assess their current level of confidence and comfort with each skill by assigning themself a score from 0 to 10. (0 is completely uncomfortable, 5 somewhat comfortable like someone just starting out in sales, 10 confident and comfortable comparable to an experienced salesperson). This survey was given out during class time to assure that all students completed it. The same survey was given out at the end of the course. Note that one student, Lucas, was not present on the day the pre-survey was given out, he did complete the post-survey, however I removed him from the results.
Prior to the start of the course, at least two meetings were held with representatives from PNM. These meetings served as pre-course interviews designed to clarify project expectations, define measurable goals, and establish implementation procedures for the Calling Project. Information gathered included:
student compensation through scholarships based on qualified appointments set and appointments kept,
the criteria for determining qualified leads and the process for booking appointments with the PNM sales team,
the communication artifacts and promotional materials PNM would provide (e.g., a promotional slide deck for emails, approved logo, and informational materials describing EV charging stations),
procedures to ensure students receive credit for lead generation in cases where leads contact PNM directly after outreach, and
stakeholder’s desire to create awareness among businesses that EV charging stations can be installed on their premises.
The appointments made and kept, were tracked and checked after each calling period. At the end of the calling project, total lead generation performance was checked. Qualitative data was collected through an interview to determine whether stakeholder’s needs and expectations were met. This included assessing the perceived extent to which the project increased awareness among businesses that EV charging stations could be installed on their premises. Table 1 shows the plan, goals, and results for the Calling Project with PNM as tracked.
Procedures for Analyzing Data and Results
Student self-evaluation data was analyzed using paired t-tests to determine whether there was a statistically significant change in students’ comfort and confidence in the sales process from beginning to end of the course. Because the same students completed both the pre-course and post-course self-assessments, the paired t-test compared each student’s own growth, rather than comparing one group to another. This made it a strong method for evaluating individual learning gains over time.
Gratitude is expressed for Dr. Dimitri Kapelianis,Associate Professor, ASM Marketing Information Decision Sciences MIDS, who used the data that I collected and ran the paired-samples t tests on that data. His comments and the APA-style narrative follow. In addition, the APA style Table are in Appendix B.
Note that N or sample size = 19 and not 20 because Lucas completed the post survey but did the pre survey
And congrats on these results. These are fairly big effect sizes in terms of improvement!
Below is an APA-style narrative.
APA-style narrative on Pre- and Post- Surveys
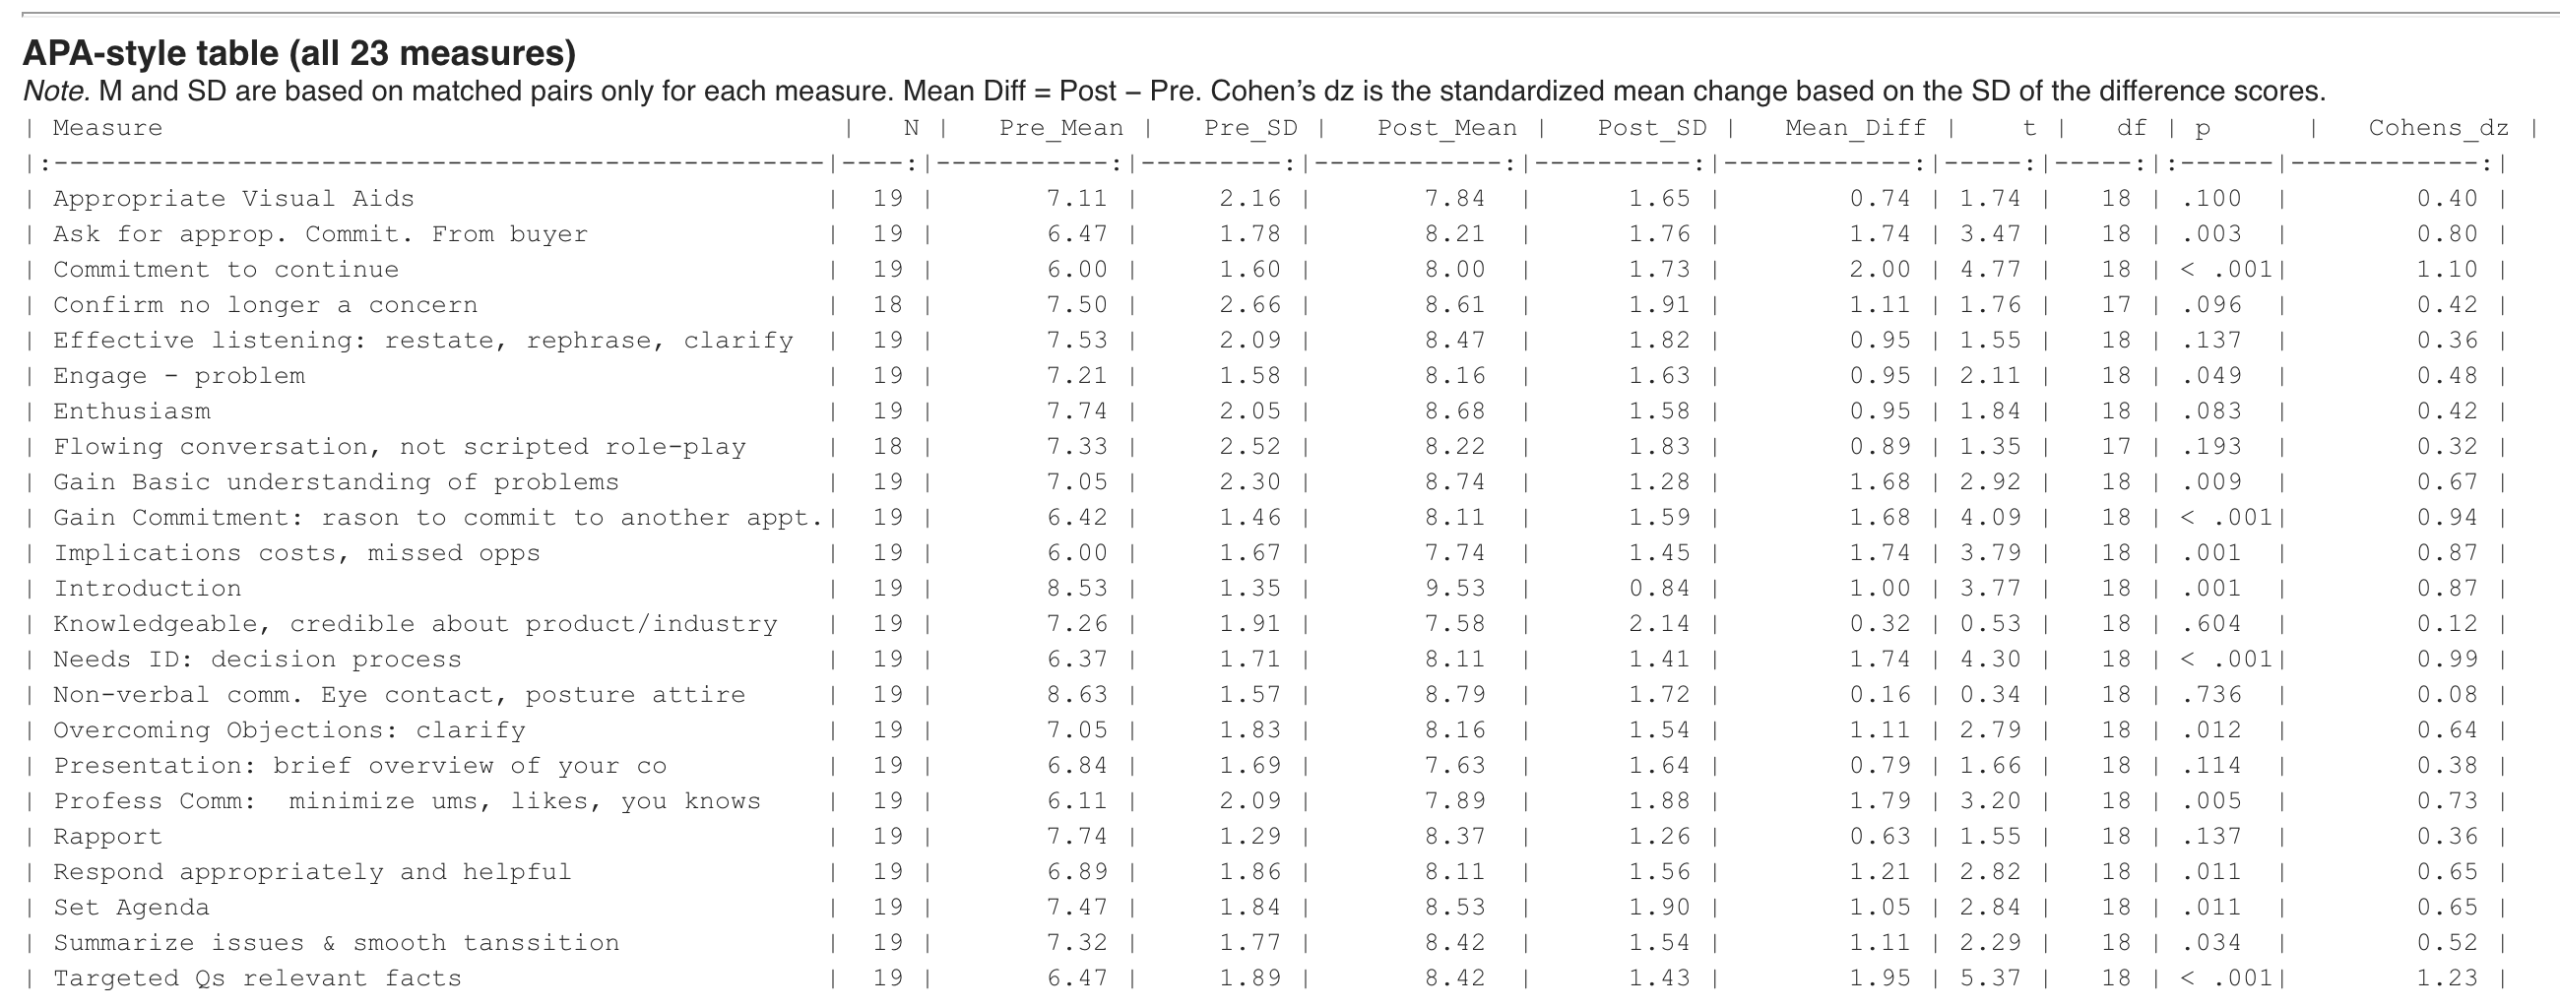
Paired-samples t tests were conducted to compare students’ self-ratings on 23 sales-competency items before and after the course. Scores were matched by student (N = 19), with pairwise Ns of 18 for “Confirm no longer a concern” and “Flowing conversation, not scripted role-play” due to missing data on one survey.Across the 23 competencies, post-course ratings were higher than pre-course ratings for every item. Statistically significant gains (p < .05) with medium to very large within-subjects effects (dz ≈ 0.48–1.23) were observed for the following competencies: Introduction, Engage – problem, Set Agenda, Commitment to continue, Needs ID: decision process, Targeted Qs relevant facts, Gain Basic understanding of problems, Implications costs, missed opps, Summarize issues & smooth transition, Overcoming Objections: clarify, Respond appropriately and helpful, Gain Commitment: reason to commit to another appt., Ask for appropriate. Commit. From buyer, and Profess Comm: minimize ums, likes, you knows. For example, students reported large increases in asking targeted questions to elicit relevant facts, t(18) = 5.37, p < .001, dz = 1.23, and in their commitment to continue the sales process, t(18) = 4.77, p < .001, dz = 1.10.
Several additional competencies showed positive but non-significant improvements, with small-to-moderate effects: Appropriate Visual Aids, Confirm no longer a concern, Presentation: brief overview of your company, Rapport, Effective listening: restate, rephrase, clarify, Flowing conversation, not scripted role-play, Enthusiasm, Knowledgeable, credible about product/industry, and Non-verbal comm. (eye contact, posture, attire), |t(17–18)| ≤ 1.76, ps ≥ .083, dz ≈ 0.08–0.42. Thus, while all competencies trended upward, statistically reliable gains were most pronounced for competencies related to needs diagnosis, implication questioning, commitment-gaining behaviors, and several aspects of professional verbal communication.
A meeting after completion of the calling project with the stakeholders of PNM and UNM. Following this the quantitative and qualitative analysis comparing the goals and results.
Table 1
Goals, results and notes for the calling project with UNM and PNM
| Goal: Beginning of Project | Results: End of Project | Notes | |
|---|---|---|---|
| Number of PNM Leads provided | 1000-2500 leads: Hotels, Apartments, Parking Lots, Gas Stations, other | 2336 Leads added: October 8th through November 12 | |
| Student: Number of Qualified Meetings Set | 100 meetings booked “would be amazing” | 43 meetings booked 24 meetings kept | Appointment Set and Lead Sheet filled out for each meeting booked by students. |
| PNM: Number of Qualified Meetings Kept | Goal 90% kept | 55.8% Appointments kept. | Initially, they were not confirming it would be a Zoom or Teams call. |
| PNM Engagement with class (Days/week) | Alanna there at least once a week | Alanna there every Monday and Wednesday | |
| PNM scholarship: $20/meeting set plus $50/meeting kept | $7000 = 100 * $70. If this stretch goal is reached, an additional $3000 contributed | $860 for meetings booked. $1200 for meetings kept. $2060. Plus Party at Main Event: $2274.96 | |
| Needs and Expectations | Create awareness. There is a compliance to dispensing businesses. Reach out-generate leads? UNM find barriers to installations: Capital, placement, noncompete agreements with gas suppliers, etc.? Called X#s with NICS code 123 in City. What’s the percentage of each? Where are they in the journey? Awareness | – “Pretty good. PNM was talked about to every person, whether they got a “no” or not. It’s building awareness.” – J.Williamson, “I’m really proud of the work that the students did.” – UNM download HubSpot to PNM — analysis. – A. Phillips, “The amount of outreach the students have achieved is pretty incredible and that point total is something surely to be celebrated.” -UNM Download all HubSpot data. | All PNM contacts made through HubSpot were given by PNM. PNM wants data determine where businesses are on their journey to installing an EV charging station. They can also do the assessment of general awareness. |
| What can we do to make it better/improve? | Student feedback – Frame the value proposition for customers, Negative feedback to students. Any additional data points is super helpfu Maybe the money is not the motivating factor for some students. Combine this and the Rich Ford completion – sell a Electric Vehicle | When setting appointments, make sure to clarify if it will be a phone call or a Zoom/Teams meeting. |
Timeline
Fall 2025 semester.
The pre-course survey was given out the first week of the semester. The post-course survey was given out the week of November 17th. See results in Appendix B.
PNM Calling Project:
The first planning meeting with PNM was held on September 9th.
PNM presented their EV Charging Station information to the class on September 15th.
Students called twice a week, Mondays and Wednesdays during class time (12:30 to 1:45) from October 13th to November 12th.
A presentation was made to PNM by the students on December 3rd to share individual growth, wins, challenges, and results. PNM also shared how their needs and expectations were met.
On December 5th, scholarships were given to the individual students based on their performance during the calling project.
Conclusion
Both the students’ results and the expressed outcomes from this course were successful. The quantitative data of improvement in comfort and confidence and comfort in the sales process as analyzed, showed improvement in all areas. The results can be used in future semesters to make sure that the areas that did not show statistically significant improvement are areas that more experiential learning can be focused.
In addition, the qualitative data from interviews with the corporate partner indicated that the semester results of appointments set and kept were satisfactory. The “party” at the end of the semester for goals reach was thrown. As you can see in the notes, they were very satisfied with the student’s activities and the awareness that was created.
Appendix A – Pre- and Post-Survey
Appendix B – Survey Results
APA-style table (all 23 measures)
Note. M and SD are based on matched pairs only for each measure. Mean Diff = Post − Pre. Cohen’s dz is the standardized mean change based on the SD of the difference scores.